Intro and Motivations
The uptake of electric vehicles (EVs) has been increasing in Singapore over the past decade and is expected to ramp up further in the lead-up to 2030. In particular, passenger EVs formed 32.1 per cent (%) of all new car registrations in the first half of 2024 (LTA 2024). This trend culminates in EVs being expected to account for 80 per cent of all passenger vehicles by 2030, according to Bloomberg New Energy Finance (BNEF)’s Electric Vehicle Outlook 2024. This occurs as consumers are increasingly incentivised to make the switch away from conventional vehicles running on internal combustion engines (ICE) in a bid to introduce a “cleaner-energy” fleet (SG Green Plan 2030 n.d.) through a combination of financial and regulatory factors.
Singapore’s EV transition must be supported by a slew of ancillary infrastructure, the most crucial being a nation-wide ubiquity of EV charging stations. To this end, Singapore intends to deploy 60,000 EV charging points around the island by 2030 (SG Green Plan 2030 n.d.)1. The electricity required to charge these cars, however, poses a huge demand in the next six years for clean energy – this is something that Singapore currently does not have in abundance, with 95% of its energy generation coming from natural gas sources (EMA n.d.-a).
This paper thus considers the possibility and feasibility of constructing fully solar-powered public EV charging facilities in Singapore to provide an alternative, and most importantly clean, source of electricity for EVs. PV installations are already widely deployed in Singapore; specifically, solar-powered EV charging facilities have been pioneered by Sembcorp and Shell as successful proofs-of-concept (Sembcorp 2021, Shell n.d.). Yet, while technical potential for additional solar capacity still exists in Singapore, the question of whether available roof space large enough to retrofit the necessary solar fixtures to power EV charging facilities exists is a poignant one.
Thus, to answer this question, this paper seeks to identify potential public building typologies which can play host to these new-build solar-powered EV charging installations. Part I of this paper lays out the context and technical assumptions for the project. The second section then identifies specific currently-existing buildings across four public building typologies that could have sufficiently large footprints to house new-build PV installations to power two separate configurations of EV chargers for a 15-hour period (between 7:00 and 23:59 in a given day). Since the aim is to identify possibilities for 100% solar-powered EV charging, this paper considers off-grid PV installations in order to not take energy from the grid that might be generated from non-renewable sources.
The results, laid out in Part II, however, reveal that due to the high energy requirements, existing infrastructures available for retrofits are relatively scarce even when discounting the specific profiles of roofs required to house solar panels. Against this, Part III is more experimental and ruminative and proposes a design of a new public building typology – a multi-modal transport hub – that will present opportunities for solar-powered EV charging and other co-benefits for increased and more efficient public transport usage.

PART I: Context-Setting and Technical Assumptions
Increasing EV adoption in Singapore, and its impact on the grid
Passenger EV adoption in Singapore is steadily increasing. While petrol and hybrid-electric vehicles – primarily petrol-electric – are still more prevalent, the number of registered fully-electric vehicles has roughly doubled year-on-year since 2020, totalling 11,941 EVs in 2023 (LTA 2023a) (Figures 2 and 3).


This increase can be attributed due to combination of political, cost, and infrastructure-related factors. Firstly, as part of its SG Green Plan 2030, Singapore has committed to a staggered phase-out of ICE vehicles in line with its mission to target “cleaner-energy vehicles” (SG Green Plan 2030 n.d.). From 2025 onwards, Singapore will not permit any new diesel cars or taxis to be registered; from 2030 onwards, no new petrol, petrol-CNG, or CNG passenger vehicles can be registered (LTA n.d.-a). While this change might not solely affect consumer purchase decisions in the short-term, a combination of cost and infrastructure factors might begin to nudge would-be purchasers towards cleaner alternatives (Ong 2024).
Research by Nishanthen and Yeow (2019) and Xu et al. (2017) has found that the key factors affecting decisions to purchase of EVs in Singapore can largely be grouped into two categories, namely cost and charging infrastructure availability. Firstly, a combination of policy and production cost reductions will result in increased affordability of EVs. The Singapore government has instituted two schemes – the EV Early Adoption Initiative (EEAI) and the Vehicular Emissions Scheme (VES) – which allows buyers to enjoy a rebate of up to $40,000 on the purchase price depending on the make and model of their EV until the end of 2025 (LTA 2023b). The production cost of EVs will also, on average, fall below that of ICE vehicles by 2027 due to advances in manufacturing processes, according to the market research firm Gartner (2024). Secondly, a planned increase of charging stations deployment will assuage concerns regarding charging. The Singapore government intends to install 60,000 EV charging stations islandwide by 2030, up from some 6,700 public and 7,100 private charging points as of the first half of 2024 (LTA 2024, Loi 2024). The affordability and ubiquity of charging infrastructure will likely work in tandem to reduce the barriers of entry to EVs for new buyers towards 2030.
This trend, however, will undoubtedly exert a strain on Singapore’s power grid. For comparison’s sake, the average household residing in a 5-room Housing Development Board (HDB) flat currently uses about 15 kilowatt-hours (kWh) of electricity per day (according to available data). By comparison, the average consumption of an EV is 19kWh per 100km (EV Database n.d.) – this means that charging an EV to drive the length of Singapore three times would use more electricity than the average household in a given day. If we assume that Singapore’s passenger car population stays roughly at 650,000 in 2030 (LTA 2023a), providing enough clean electricity to charge an EV fleet of 520,0002 will prove a steep challenge. While the conversion of all ICE vehicles to EVs could yield about 50% carbon savings over the long term even assuming Singapore’s reliance on natural gas for its electricity continues to hold (Ong 2021), the potential for carbon abatement can be increased even further with clean electricity inputs from solar, wind, and other renewable sources (Wang et al. 2013, Gao et al. 2023).
Renewable electricity options and the feasibility of solar
Singapore’s power sector is still largely reliant on fossil fuel sources. In 2023, natural gas accounted for 93% of Singapore’s power generation, which generated 94% of its total power sector emissions (Ember Climate 2024). Singapore intends to reduce this share, and its Energy Market Authority (EMA) has shortlisted four options – or ‘switches’ – for decarbonising its power sector whilst being able to ensure reliable generation. These are: natural gas with hydrogen co-firing, electricity imports, solar with battery storage, and low-carbon sources (like geothermal or nuclear energy) (EMA 2023).
Considering only the options for renewable energy generation within Singapore for the purposes of this project, only the latter two are relevant. Of the two, solar energy is the comparatively more ubiquitous and available source, due to the relative nascence of advanced geothermal technologies (EMA 2024a). To this end, solar photovoltaic (PV) systems are already widely installed in Singapore, with a cumulative total of 9,763 PV systems installed nationwide as of the first half of 2024, amounting to 1.35 gigawatt-peak (GWp) of total capacity (EMA 2024b, EMA n.d.-b). The Solar Energy Research Institute of Singapore (SERIS) has, however, estimated that Singapore has a technical solar potential of 8.6 GWp by 2050, considering usable areas for rooftop, façade, mobile/land-based, floating, and infrastructure-based PV3 (Reindl 2020). Thus, there is still a sufficiently-large area for the construction of additional solar systems for this particular solar-powered EV charging typology.
This investigation will only consider solar PV configurations on existing buildings as the available plots of land space for mobile or land-based applications (0.38km2) and infrastructure-based PV (0.004km2) on Singapore’s mainland is limited, while the available space for floating solar in inland reservoirs and “dead-sea” spaces is generally located far away from populated areas (Reindl 2020).
There are two main categories of configurations to attach solar panels onto buildings: building-attached PV (BAPV) and building-integrated PV (BIPV) systems (Barkaszi and Dunlop 2001, Ding et al. 2023). BAPV systems refer to PV panels that are mounted on top of roofs without changing the roof’s internal structure (Figure 4), while BIPV systems are specialised building materials that replace conventional roof tiles or other roof materials and require no mounting (Figure 5).


BAPV systems, however, have a number of key advantages over BIPV systems. Firstly, keeping PV system capacity constant, BAPV systems generate more energy than BIPV systems. A simulation performed by Kumar et al. (2019) comparing BAPV and BIPV configurations of a constant 32.7 kWp capacity in Malaysia finds that the capacity utilisation factor4 for BAPV is higher than BIPV by 0.21-0.59% across three different PV technologies. Moreover, vertical façades receive less irradiation than horizontal façades in Singapore due to a lower solar angle and shading effects from vegetation and other buildings (Lau et al. 2021). Moreover, the payback period of BIPV systems are often prohibitively long due to high upfront capital cost (between 10-20 years, depending on subsidies and feed-in-tariff support) (Lau et al. 2021, Lu et al. 2019, Chen et al. 2022). Finally, due to the technical complexity and stringent fire safety regulations imposed by the Singapore Civil Defence Force (SCDF) to prevent façade fires, the implementation of BIPV faces a significant roadblock over BAPV. Thus, due to its technical feasibility (and therefore ubiquity) over BIPV in Singapore, this paper will focus on rooftop BAPV panels for EV charging applications.
Technical assumptions for required roof space calculation
The required roof space for solar panels is determined by the intended configuration of EV chargers. Four main kinds of chargers exist in Singapore: Mennekes Type 2 (AC), CHAdeMO (DC), CCS2 (DC), and Tesla’s Supercharger (AC/DC) (SCS 2023). AC charging stations are generally available in power ranges of 7kW, 11kW, 22kW, or 43kW (fast-charging), while DC charging stations are available in power ranges upwards of 50kW. While fast-charging applications are preferred, the reality is that the energy requirements are likely too high for an off-grid solar-powered system to supply adequately to it (Shell’s fast-charging 180kW stations are likely grid- connected (Lee 2023) for this reason). Thus, two configurations of charging stations are considered: four 11kW chargers (Configuration 1) and four 7kW chargers (Configuration 2). The PV installations will need to generate enough energy for all four chargers to discharge continuously for 15 hours (i.e., 7:00 to 23:59), taking a blanket assumption that limited charging is done at public locations in the early morning (between 0:00 and 6:59). Finally, given that Singapore’s surface irradiation dips heavily after 4pm5 (Figure 6), an on-site battery storage system will be integrated to shift the energy to ensure a steady source of electricity after 7pm6.
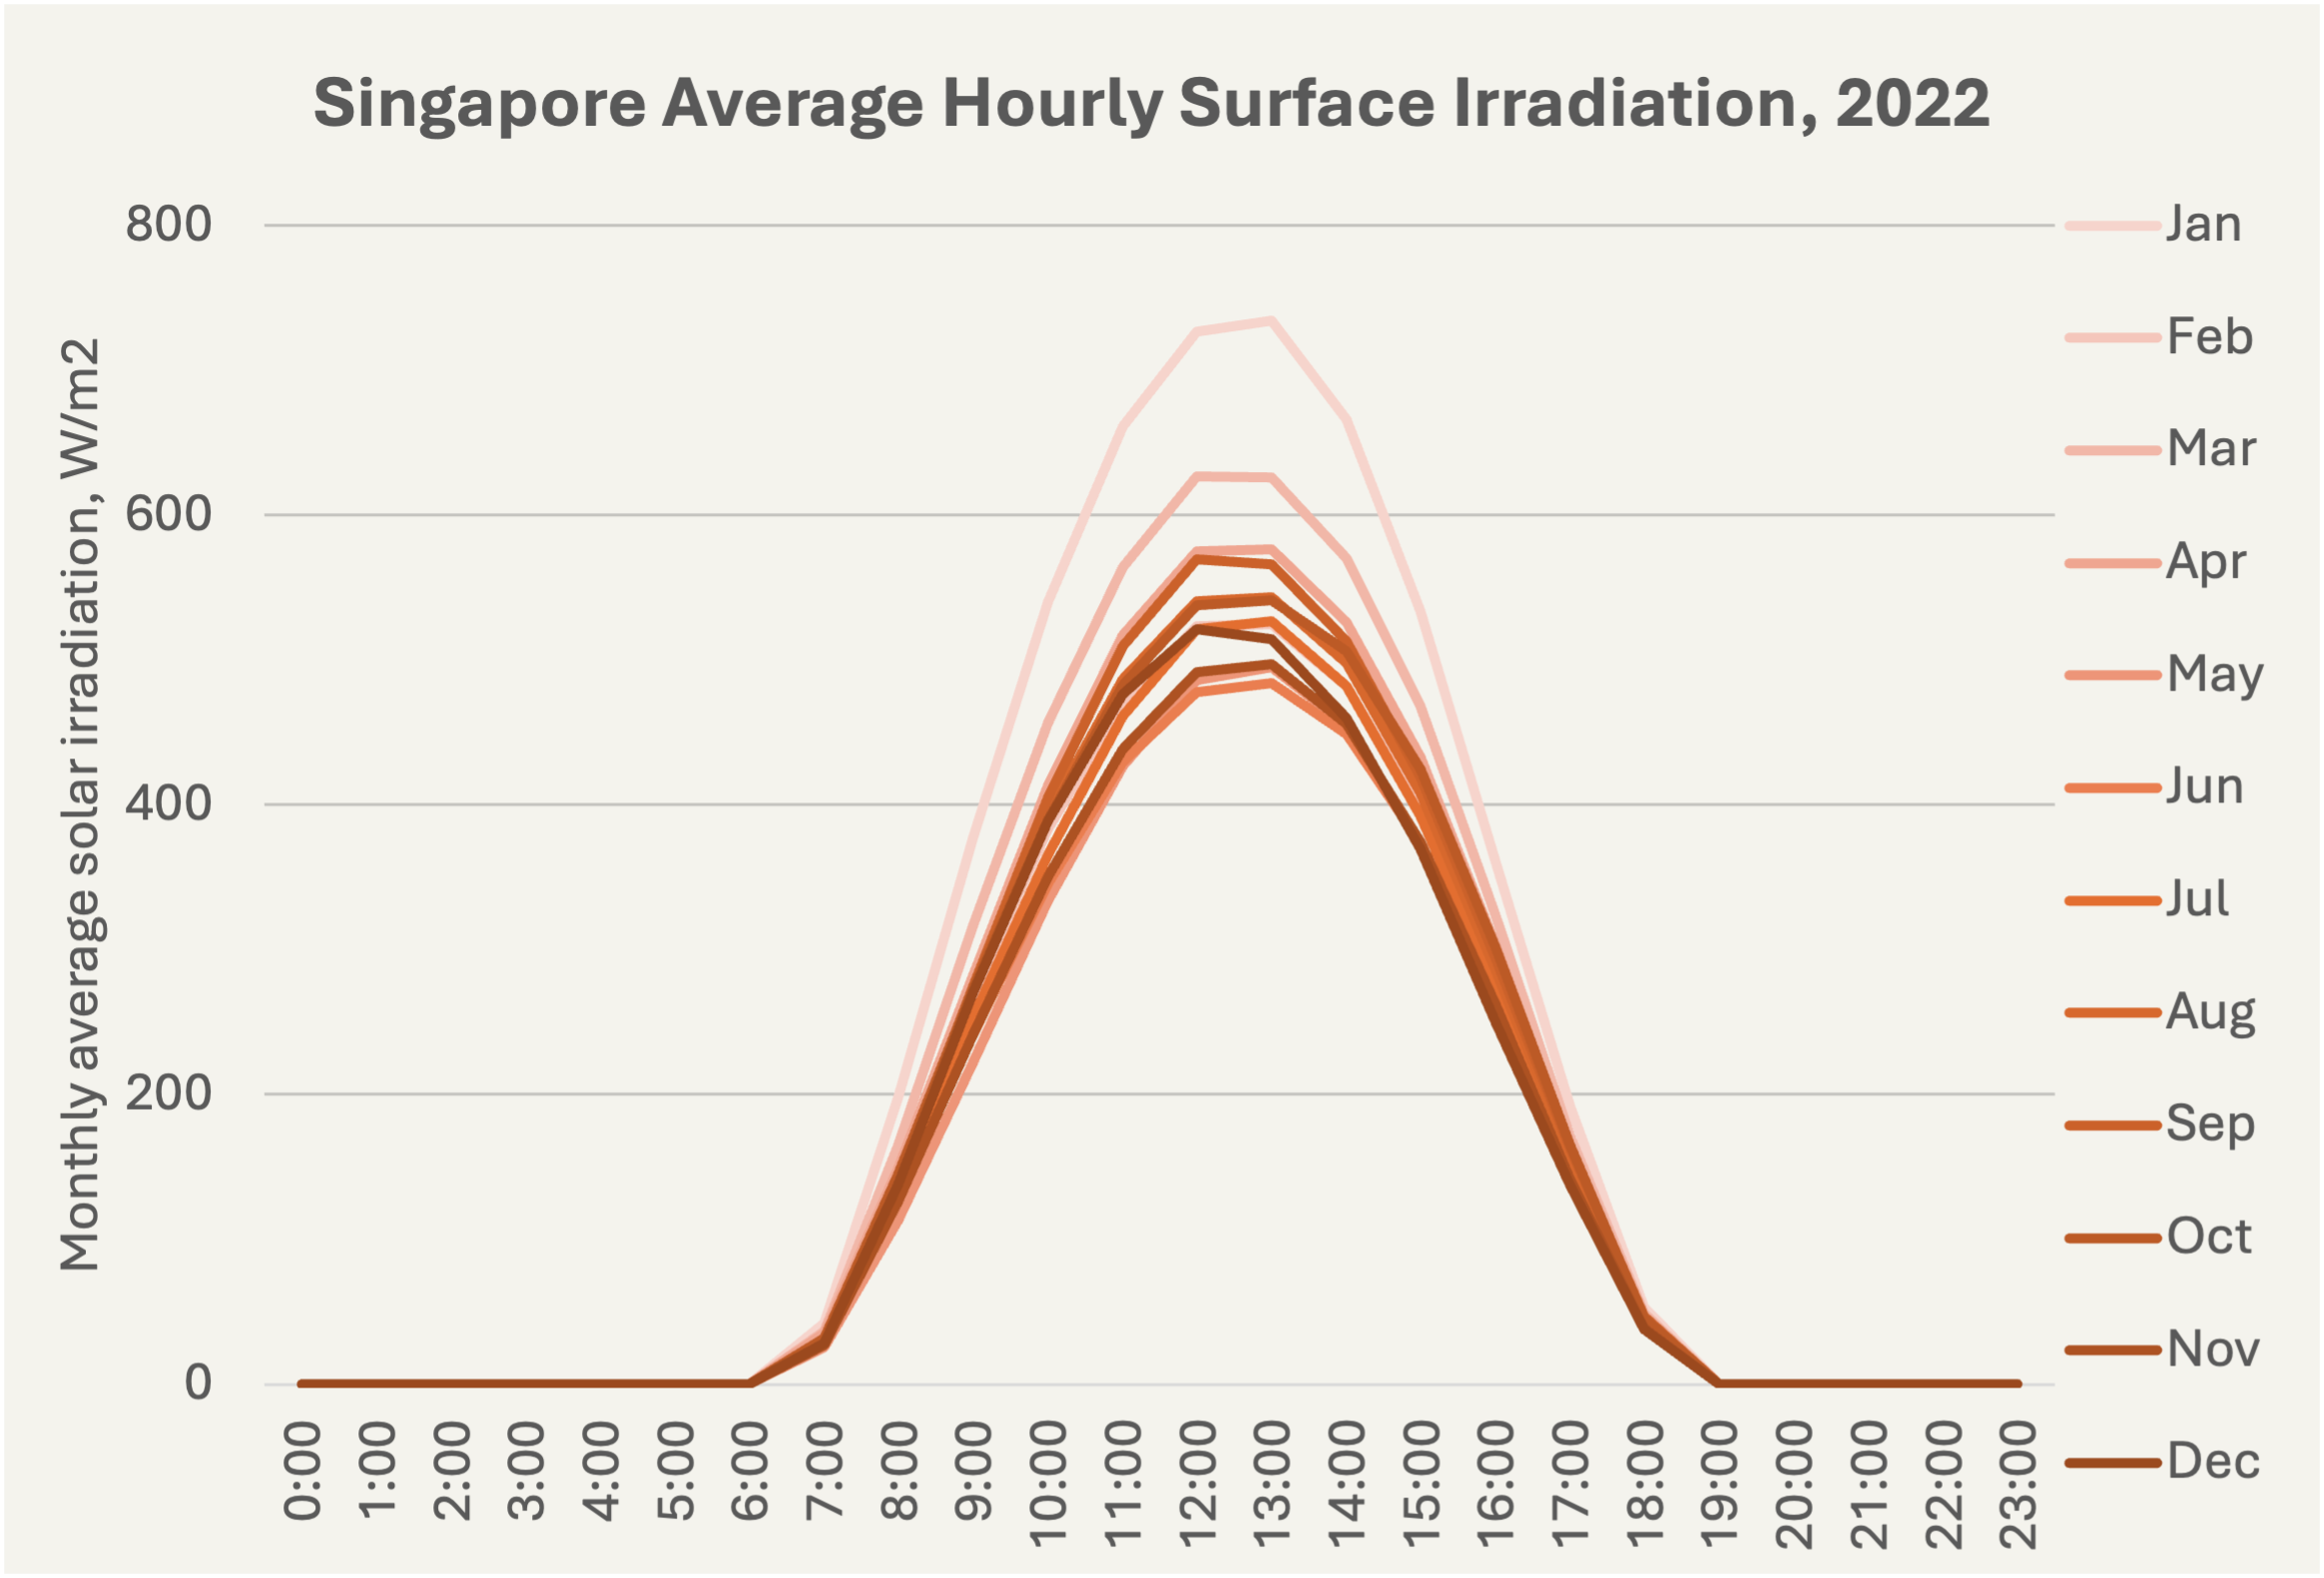
The EV charging losses from the on-vehicle conversion of AC to DC is assumed to be 10%. The solar panel performance ratio7 is assumed to be 80%, taking a generous assumption of the values derived from Kumar et al.’s (2019) simulation. The capacity utilisation factor is assumed to be 20%, based on the high end of the range of capacity factors across ASEAN as determined by Fahim et al. (2023). The average solar irradiance used is 1,580 kWh/m2 as given by the EMA (n.d.-b). The PV to area ratio used follows the area factor8 given in the SERIS (Reindl 2020) study of 0.14 kWp/m2, and assumes a further 20% additional space needed for other ancillary infrastructure like batteries or power electronics (i.e., 80% space utilisation factor). The calculation for the necessary area required is as follows:

Based on the inputs, the computed rooftop area9 required is 6015.95m2 for Configuration 1 and 9453.64m2 for Configuration 2.
A copy of the calculator for this roof space determination can be provided on request. A screenshot is available in Appendix A.
PART II: Which Public Buildings in Singapore Are Large Enough and Don’t Yet Have Solar Panels?
As noted earlier, Singapore has limited available building space for new-build PV installations, and this number is even smaller when only considering the available space on public10 buildings for BAPV applications. Within this context, this section employs a spatial analysis that aims to investigate the available space across four public building typologies: above-ground MRT stations, MRT or bus depots, sports halls or centres, and university buildings.
Typology selection rationale
The above four typologies have been selected based on a qualitative filtering method from an initial scan of the types of public buildings in Singapore. Residential, commercial (i.e., shopping malls), and industrial buildings were not considered due to the complexity and huge variance between individual building structures. HDB blocks, in particular, are omitted from this study due to the existence of the SolarNova project, which aims to accelerate the buildout of solar panels on HDB buildings for residential electricity consumption (HDB 2022). Hospitals are also excluded due to a pre-existing plan to gradually retrofit such buildings with PV installations (Tan 2023). This leaves transport, leisure, and education-related infrastructure as remaining building types of choice.
The typologies selected to be considered then needed to meet at least three of the following criteria:
- Are accessible to the general public;
- Are places where people could leave their cars for a set period of time to charge and conduct certain activities;
- Are spread across the island and can cover various neighbourhoods and new towns; and/or
- Are likely to have large-enough roof spaces.
Above-ground MRT stations, MRT or bus depots, sports halls or centres, and tertiary institutions have been selected for the scope of this section as they fit the criteria mentioned above. The relative ease of obtaining data from OSM for these typologies also factored into the selection. Other aspects such as shading and building orientation have not been considered as they highly complex to model, and are out of the scope of this study.
Methodology
A spatial analysis is conducted through QGIS, using data obtained from OpenStreetMaps (OSM) and the National University of Singapore’s (NUS) Urban Analytics Lab (UAL)’s Roofpedia registry to identify specific buildings across these four typologies. The dataset of all individual buildings in OSM within Singapore’s boundaries is obtained from Geofabrik, and the subset of specific typologies is downloaded from MyGeodata Cloud. The data is then cleaned and processed in QGIS, and individual shapefiles are obtained for each specific typology. The shapefiles are then intersected with the shapefile from Roofpedia to identify which buildings already have solar panels installed (as of 2021), and an inverse selection is made to identify buildings that do not already have panels installed. A filtering process is then identified to extract individual buildings11 across the four typologies that have a footprint of above 9453.64m2 and 6015.95m2 respectively. A final round of review is conducted through Google Street View and Google Earth to identify whether these buildings have already been retrofitted with panels since 2021 and the types of roofs that these buildings sport (Figure 7). A spatial process diagram is available in Figure 8.


Results
The results from the spatial analysis show that, unfortunately, very limited availability exists across these typologies for buildings that exceed the required building footprint to construct PV installations to fit the energy generation needs for both Configurations 1 and 2. The MRT or bus depots typology contains the most buildings that are large enough to serve Configuration 1 (i.e., larger than 9453.64m2), and tertiary buildings contain the second-most. These two typologies also contain the most buildings large enough for Configuration 2 (i.e., larger than 6015.95m2). At the other end of the spectrum, MRT station roofs are far smaller and are insufficient to serve Configuration 1, but roofs are mostly flat. A few sports halls and centres are large enough but have roof structures that might not be completely optimised for PV installations. A detailed list of these buildings is included in Appendix B.
Typology 1: MRT Station Roofs
Only three MRT existing station roofs fit the building footprint requirement for Configuration 2: Jurong East Station (9244.65m2); Canberra Station (8981.01m2); and Marsiling Station (6407.09m2). None are large enough to fit the requirement for Configuration 1. The three stations sport largely flat or gable roofs (see Figures 9, 10, 11), which are generally ideal for PV installations (Li et al. 2020).


Typology 2: MRT or Bus Depots
Six buildings within this category are large enough to fit the footprint requirements for Configuration 1, notably, the Tuas Bus Depot (30727.66m2) and the Sengkang MRT Depot (23871.16m2). A further six are large enough to serve Configuration 2. These buildings are largely distributed around Singapore (see Figure 12), and if installed at these locations, the solar-powered EV charging stations can theoretically serve larger populations. It is also notable that most of these depots – like the MRT station roofs – sport either slightly curved shed roofs or completely flat roofs (see Figures 13 and 14), making them ideal for PV installations (Li et al. 2020). However, as these depots are generally not publicly-accessible due to security considerations, areas adjacent to these depots can be reconfigured to serve as public charging lots (see the case of Bishan MRT Depot, Figure 15).


Typology 3: Sports halls or centres
Only three12 sports halls or centres have roof structures that are large enough to accommodate PV installations large enough for Configuration 2: the roof over the grandstand in Choa Chu Kang Stadium (8941.25m2); OCBC Aquatic Centre (8763.81m2); and Sengkang Swimming Complex (6862.34m2). Like Typology 1, none are large enough for Configuration 1. The latter two have slightly curved roofs that could make them suitable for adding panels (see Figures 16 and 17). Conversely, Choa Chu Kang Stadium’s grandstand roof sports a slightly curved shape but its outstanding trusses could drastically reduce the available space for installations (see Figure 18).


Typology 4: University buildings
Buildings within this typology refer to all buildings within the confines of the seven autonomous universities in Singapore13. Four such buildings islandwide are large enough to host PV installations for Configuration 1: the National University Hospital (NUH) Main Building in NUS (17379.03m2); the SUSS Main Campus (14217.053m2); SIT Dover’s Block 20 (13175.51m2); and NUS’ University Cultural Centre (10118.62m2). A further five buildings are large enough for Configuration 2. However, while most of these buildings sport portions of flat or slightly-curved roofs and could host PV installations, the actual roof space for available solar panels is likely lesser than the total building footprint due to the non-linearity of the roof spaces (see Figures 19 and 20). That is, building-specific designs (curved surfaces, scattered extrusions) render a certain percentage of the area unusable. Moreover, a number of these institutions have already instituted plans to input solar panels on their buildings’ roofs going forward to decarbonise their institutions’ electricity consumption (BCA 2022; NTU 2022), which could reduce the likelihood of them being available for this specific use-case.


Discussion and Limitations
From our scan of public buildings in Singapore that do not already have solar installations, there are very few which are large enough to fit the requirement to host PV installations for Configuration 1, much less Configuration 2. The buildings that do fit the roof footprint requirement, moreover, tend to have roofs that are not exactly perfectly suited for solar panels. Of the four typologies, MRT station and MRT or bus depot roofs have been found to consistently sport the flat or shed- type roofs that are commonly assessed to be better-optimised for solar energy generation (Li et al. 2020). While university buildings assessed within the scan might have the flat (or curved) roof types that benefit PV installations, the roof spaces themselves tend to be non-linear and have curved surfaces and other extrusions that reduce the actual space that can be used. The same kind of variability in roof shapes also applies to sports centres; it is uncertain if solar panels can be installed on roofs which have various extrusions (e.g. upstanding columns or trusses) for specific design or structural purposes.
The specific framing of the study (as laid out in the ‘Typology selection rationale’ section) has undoubtedly created certain limitations in the number and type of buildings assessed to be feasible for sizeable PV installations. Firstly, the framing excludes certain categories of public buildings that are sizeable and sport generally flat roofs such as HDB multi-story carparks (MSCPs). This typology would have been a prime candidate for the study but was ultimately limited by the extent of available data14. Additionally, with an increasingly common design for HDB projects where HDB point-blocks are stacked on top of carparks, the boundaries of the carpark blocks become unclear and difficult to whittle down in the filtering process. Moreover, the available space on top of these buildings is limited as many of them are fitted with green roofs.
Secondly, the framing excludes privately-owned commercial and industrial buildings. This was done specifically in view of the large variety of building designs; the study took the base assumption that flat, shed, or gable roofs would be more suitable to install PV applications. There is the potential that industrial-area buildings could be promising sites for this typology, but their location away from residential heartlands makes them a less attractive option.
Ultimately, the issue of opportunity cost is a prime consideration that I have thus far refrained from discussing due to the exploratory nature of this project. Building solar panels solely for EV charging is not efficient: as proven, EVs are energy intensive and will require a high PV installed capacity, and this can come into conflict with electricity required for the building instead. Thus, where solar panels can be built to help decarbonise the building’s electricity consumption, they will likely be built; we observe this trend through NUS and NTU’s respective initiatives to equip more and more of their buildings with solar panels for this purpose.
Finally, while I have designed my theoretical study around an off-grid solution based off the intention to ensure that 100% of the electrons used to charge EVs come from renewable sources, off-grid systems are generally discouraged in Singapore. This is because of a confluence of three main reasons: first, that the entire country is well-connected by the grid and that any additional energy required can be easily taken from the grid, ensuring reliability; second, that additional solar energy generated can be provided back to the grid, especially with the future potential for virtual power plants (VPPs)15 in Singapore (EMA 2024c); and third, that Singapore is simply too land-scarce for solar projects that are meant for high-load applications. Unfortunately, unless solar PV technologies become drastically more efficient at capturing and generating solar energy, it seems that the feasibility of this configuration will remain low.
PART III: A New Typology For Transit Hubs
Thus far, the scan has enumerated that there is a lack of available existing public buildings that are large enough to house solar panels which can solely generate a sufficient amount of energy to power a reasonable number of charging stations for a given day. But if current buildings are not possible, what about future buildings? How could we design public building typologies that could potentially prove sufficiently large to install solar panels that could both power EV chargers and other uses of electricity for the buildings as well?
Firstly, public transport infrastructure – MRT stations and bus or MRT depots – will likely have the greatest potential for this redesign. For, the typology itself necessitates a large land area: a simple parsimonious explanation is that trains themselves are long and stations and depots must therefore be sufficiently large enough to match that length. Moreover, as Singapore looks to continually upgrade its public transport network (LTA n.d.-b), an increasing number of MRT stations and bus and train depots in and around residential areas are planned to be built within the next decade (see Appendix C). This experimental final section therefore proposes a design of an integrated transit hub that would place these various typologies together in a sufficiently large land area – assuming, of course, solar technologies evolve significantly such that their energy capturing efficiencies increase far higher than the current 20-30%16.
Three main considerations for solar-powered EV charging
A new design for transport infrastructure that will be sufficiently large for off-grid solar-powered EV charging will need to factor in two main considerations: the above- or underground status of MRT stations and the proximity of depots to MRT stations and other amenities.
The feasibility for MRT stations to host PV installations of significant generating capacity also largely correlates to their above- or underground status. From the scan, the three stations (Jurong East, Canberra, Marsiling) assessed to be sufficiently large are all on the North-South Line, one of the two existing predominantly above-ground lines. The largest building structure for any of the underground stations is Stadium (on the Circle Line) due to its unique station design, but even so, its footprint is only 4810.57m2. As for future lines, the remaining sections of the North-East, Circle, Downtown, and Thomson-East Coast Lines, and the upcoming Cross Island Line is also slated to be fully underground. The Jurong Region Line will instead be built above-ground.
With the exception of a few cases, existing MRT depots are located far away from MRT stations and other amenities (Figure 21). This is likely due to a lack of land space in and around residential areas where MRT stations and malls are generally located, and the fact that maintenance often occurs at these locations, which could present a noise concern for residents. This same trend holds for depots that are under construction. This presents a problem for our intended build of EV charging stations at these locations as car owners are likely to leave their cars to charge at such far-removed locations.

A multi-modal transport hub
The new design will therefore have to address the two issues surrounding the building of solar panels for EV charging for current and upcoming transport infrastructure. A straightforward way to do so would be to integrate these typologies into a multi-modal transport hub in a single project.
Certainly, such a typology is not new to Singapore. Since the opening of the Sengkang Integrated Transport Hub (ITH) in 2003, Singapore has since seen 10 more ITHs open across the island, the most recent being the Woodlands ITH in June 2021 (Land Transport Guru 2024). Interestingly enough, this ITH is one of – if not the only – ITHs to have solar fixtures already present on its roof – proving that the proposed typology is at least somewhat feasible. The key difference, however, is the lack of integration of the MRT depot due to the space and noise considerations as previously mentioned.
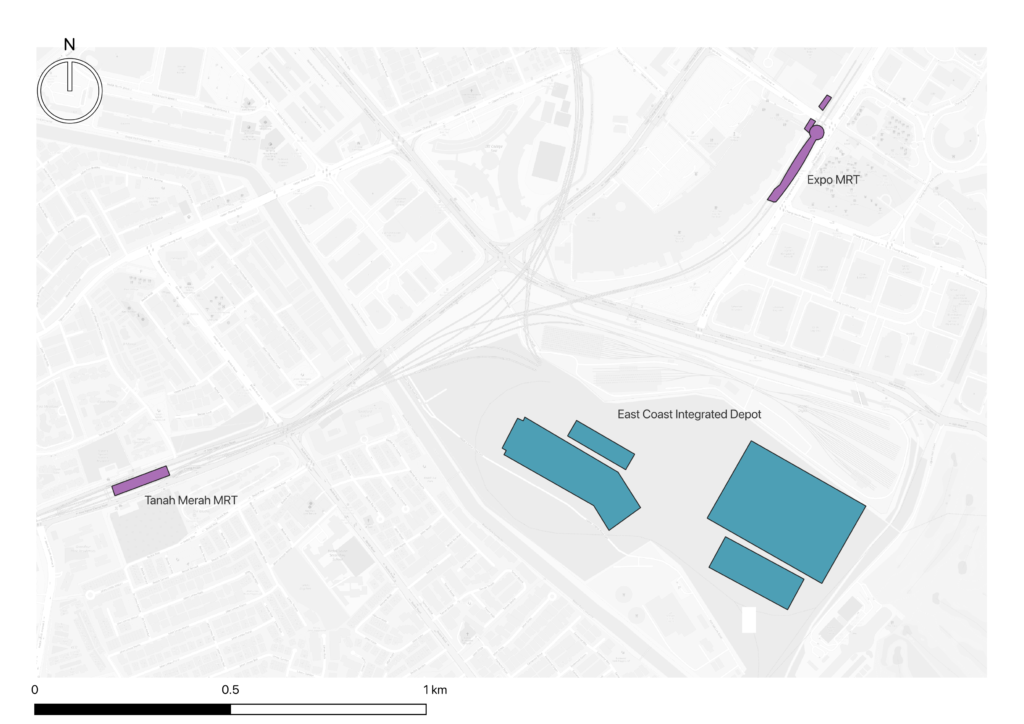
Integration of bus and MRT depots is, however, already underway. For instance, East Coast Integrated Depot (Figure 22) will be the largest such depot in Singapore when it opens in 2025, with three train depots that can house a total of 226 trains stacked on top of each other and an adjacent multi-story bus depot that can house 760 buses (Lee 2022). This depot is, however, located away from the train stations – the nearest stations are Expo and Tanah Merah stations, each of which are over 1km away (Figure 23)17.

The proposed design therefore builds on the theoretical base of the ITHs and the East Coast Integrated depot and suggests a possible design that can integrate all four typologies – bus and MRT depots, MRT stations, and bus terminals – in a single project. A model of this typology can be found in Figure 24. More detailed snapshots of the model can be found in Appendix D.

The model includes four separate components: MRT depot (and its attached train tracks – brown); bus depot (peach); MRT station (teal); and EV charging shed (green). Similar to the East Coast Integrated Depot, this design has three MRT depots stacked on top of each other, but with two submerged underground. This will ensure that maintenance can be performed underground and alleviate any noise-related concerns for residents nearby. The bus depot is situated adjacent to the train depot and features a bus terminal at the first floor. Following the general trend of fully-underground MRT lines, the MRT station is subsequently submerged below the bus depot.
The vast array of flat land presents the possibility of PV installations of sizeable capacity on the roofs of the two depots and the covered train tracks. There is also a possibility for commercial or retail to be situated on a portion above the covered train tracks to maximise the use of land for the transport hub. The potential for roof gardens to be integrated with the solar fixtures on the roofs of these structures can increase the aesthetic look and feel of the overall project to produce one that is well-integrated with the surroundings.
Conclusions and Further Extensions
What I have sought to do in this project thus far has been threefold. First, a review of the context surrounding the state of EVs, Singapore’s energy situation and the feasibility of solar has shown that while the EV fleet is slated to increase in the coming years, Singapore also faces a difficulty in terms of decarbonising its electricity. In particular, the potential of solar for Singapore is restricted by a combination of land space and limited peak surface irradiation (due to generally cloudy weather).
Given these limitations, I sought to explore whether it is at all feasible to implement off-grid solar-powered EV charging configurations on public buildings in Singapore. Setting two configurations of 4 x 7kW and 4 x 11kW chargers respectively, a scan across four public building typologies was undertaken. The results, however, show that the number of buildings which fit this criteria is limited. Moreover, even where buildings are large enough, complicated roof designs and competing usages present roadblocks to implementation.
The final section was a more experimental and ruminative one. Given the obvious limitations in the available infrastructure for off-grid solar-powered EV charging in Singapore, I have followed up by proffering a proposal for a new typology of a multi-modal transport hub. Such a project would not only have the roof space required for the PV installations, but also include activities for car-owners to perform while charging their cars – or even leave them there to charge while they take the MRT or bus elsewhere to perform their activities. The opportunities – both for the wider decarbonisation of personal transport and an increasing use of public transport – presented by such a multimodal typology are numerous.
Future extensions to this project could certainly increase the scope of the scan to include other buildings like HDBs or commercial sites. Retail buildings, in particular, can possibly integrate either BAPV or even BIPV technologies dependent on the building design; moreover, a shift towards designing greener buildings with more efficient solar capturing technologies could present veritable tailwinds for solar-powered EV charging configurations. Finally, an additional cost modelling will also be important to analyse the kinds of cost reduction scenarios for different components of the installation that will be needed to make such configurations cost-efficient.
In reality, grid-connected PV will likely be the configuration of choice as off-grid applications are generally deemed far too inefficient and/or expensive, especially for niche applications like EV charging where the critical mass has likely not yet been reached (considering that over 82% of cars remain petrol-powered). Regardless, I hope that this project has proved an informative intellectual exercise that could prove as part of the foundational basis for future work on the subject.
Written by Nicholas Loh and supervised by Professor Joshua Comaroff. All views are my own.
Footnotes
- One charging point relates to one charger; on average, there are 2 to 4 charging points per charging station in Singapore. ↩︎
- According to the 80% estimation from BNEF as cited earlier. ↩︎
- Infrastructure-based PV refers to PV systems that can be installed in tandem with noise barriers, or by over-building existing land, canals and roads. ↩︎
- The capacity utilisation factor is defined by Kumar et al. (2019) as “the ratio of AC energy generated (final output) by the photovoltaic system over the year to the maximum possible energy generation for a year under ideal working conditions.” (4) It is derived by taking the yield factor – the “ratio of the AC energy generated in kWh by the photovoltaic system at the output of the inverter to the nominal installed capacity in kWp” – divided by the number of hours in a year (8760) (Ibid.) In other words, it is the ratio of how much usable energy is generated by the PV system compared to its theoretical maximum capacity over a given year. ↩︎
- Data for Singapore’s solar irradiation is derived from the surface incident shortwave flux (SWGDN) data from NASA’s Modern-Era Retrospective analysis for Research and Applications, Version 2 (MERRA-2) model, as compiled by Iain Staffell, Stefan Pfenninger and Nathan Johnson (2023). ↩︎
- The size of the battery storage system is not explicitly calculated; it does not necessarily matter for the purposes of this investigation. ↩︎
- The performance ratio measures the “quality factor of the photovoltaic system,” and is the ratio of the yield factor to the reference yield – the “solar radiation resource” available to a PV system. In other words, it simply measures how efficient the PV system is in converting the available solar energy to usable energy. ↩︎
- The area factor “describes how much PV capacity (in kWp/m2) can be installed without causing shading from one row of modules to the other, and after considering a small gap between rows to enable access for maintenance works” (Reindl 2020, 31). It does not include a calculation for additional infrastructure like battery storage. ↩︎
- This is a simplified calculation for roof space. In reality, the actual roof space required has to account for variations in angle of the roof, surrounding ancillary fixtures, building-specific allowances for solar panels to mitigate against fire risk, et cetera. The calculation is derived as a proxy from which to estimate the minimum size of buildings required to construct such fixtures. ↩︎
- For the purposes of this project, ‘public’ refers to buildings that are not explicitly tagged as residential, commercial, or industrial buildings. ↩︎
- For the purposes of this project, building boundaries are defined as per OSM. Therefore, identified building boundaries may not be fully representative of the cumulative footprint of a given building project (i.e., one building might be split into two or more different buildings in the OSM output). Moreover, only the absolute horizontal footprint is considered, and the actual available area for PV installation will likely vary from building to building due to different roof designs and requirements. ↩︎
- The Singapore Indoor Stadium technically falls under this category, but its extremely curved roof shape makes the possibility of PV installations unlikely. ↩︎
- They are: National University of Singapore (NUS), Nanyang Technological University (NTU), Singapore Management University (SMU), Singapore University of Technology and Design (SUTD), Singapore University of Social Sciences (SUSS), Singapore Institute of Technology (SIT), and Singapore Institute of Management (SIM). ↩︎
- HDB carpark buildings are not geotagged well in shapefile data that is available either from OSM or data.gov.sg. Many buildings are missing either location tags or building type tags. ↩︎
- A VPP is a “network of decentralised, distributed energy resources (DERs) that are aggregated and managed like a conventional large power generation plant” (EMA n.d.-c). The presence of a VPP network means that owners of solar projects can sell their power onto the spot market as if they were large power generators and profit off any excess solar energy generated by their systems. ↩︎
- I do not present a calculation for the necessary increase in efficiency of solar PV cells required to make this typology viable because there is no theoretical limit to the dependent variable – the required land space for PV installations of a certain capacity – for this portion of the study. ↩︎
- This was derived from a simple Google Maps scan. ↩︎
Appendix A: Dashboard Screenshot

Appendix B: List of Buildings from Scan (w no existing solar panels)

Appendix C: Upcoming Bus and MRT Depots in Singapore

Appendix D: Render Snapshots


Bibliography and References
Barkaszi, Steven F. and James P. Dunlop. 2001. “Discussion of Strategies for Mounting Photovoltaic Arrays on Rooftops.“ Publication. Florida Solar Energy Center FSEC-PF-419-98.
Building and Construction Authority. 2022. https://www1.bca.gov.sg/buildsg-emag/articles/platinum-practices-how-nus-made-its-green-mark.
Chen, Tianyi, Yaning An, and Chye Kiang Heng. 2022. “A Review of Building-Integrated Photovoltaics in Singapore: Status, Barriers, and Prospects.” Sustainability 14(16), 10160.
Ding, Liping, Yuxuan Zhu, Longwei Zheng, Qiyao Dai, and Zumeng Zhang. 2023. “What is the path of photovoltaic building (BIPV or BAPV) promotion? –The perspective of evolutionary games.“ Applied Energy 340 (2023): 121033.
Ember Climate 2023. “Electricity Data Explorer.” Available at: https://ember-energy.org/data/electricity-data-explorer/.
Energy Market Authority. 2023. “Singapore Harnesses Four Switches in Energy Transition.” Forum reply. Available at: https://www.ema.gov.sg/news-events/news/forum-replies/2023/singapore-harnesses-four-switches-in-energy-transition.
Energy Market Authority. 2024a. “Our Clean Energy Future: EMA Annual & Sustainability Report FY 2023/24.” https://www.ema.gov.sg/content/dam/corporate/resources/corporate-publications/annual-reports/pdf-files/EMA-Corporate-Publications-ASR-2023-2024-20240930.pdf.coredownload.pdf.
Energy Market Authority. 2024b. “Singapore Energy Statistics: Chapter 6: Solar.” https://www.ema.gov.sg/resources/singapore-energy-statistics/chapter6.
Energy Market Authority. 2024c. “Singapore’s Future Grid Capabilities Roadmap to Pave the Way for a Resilient and Sustainable Energy Future.” Media Release. Available at: https://www.ema.gov.sg/news-events/news/media-releases/2024/sg-future-grid-capabilities-roadmap-to-pave-way-for-resilient-sustainable-energy-future.
Energy Market Authority. n.d.-a. “Natural Gas.” Available at: https://www.ema.gov.sg/our-energy-story/energy-supply/natural-gas.
Energy Market Authority. n.d.-b. “What is the potential of solar energy in Singapore?” https://www.ema.gov.sg/resources/faqs/energy-supply/solar/what-is-the-potential-of-solar-energy-in-singapore.
Energy Market Authority. n.d.-c. “Virtual Power Plants.” Available at: https://www.ema.gov.sg/our-energy-story/energy-grid/virtual-power-plants.
EV Database. n.d. “Energy consumption of full electric vehicles.” Available at: https://ev-database.org/cheatsheet/energy-consumption-electric-car.
Fahim, Khairul Eahsun, Liyanage C. De Silva, Fayaz Hussain, Sk. A. Shezan, and Hayati Yassin. 2023. “An Evaluation of ASEAN Renewable Energy Path to Carbon Neutrality.” Sustainability, 15(8): 6961.
Gartner. 2024. “Gartner Outlines a New Phase for Electric Vehicles.” News release. Available at: https://www.gartner.com/en/newsroom/press-releases/2024-03-07-gartner-outlines-a-new-phase-for-electric-vehicles.
Gao, Zhenhai, Haicheng Xie, Xianbin Yang, Lisheng Zhang, Hanqing Yu, Wentao Wang, Yongfeng Liu, Youqing Xu, Bin Ma, Xinhua Liu et al. 2023. “Electric vehicle lifecycle carbon emission reduction: A review.” Carbon Neutralisation 2(5): 528-550.
Housing Development Board, 2022. “HDB to Bring Solar Energy to Over 8,000 Blocks through SolarNova Programme.” Press release. Available at: https://www.hdb.gov.sg/about-us/news-and-publications/press-releases/HDB-to-bring-solar-energy.
Kumar, Nallapaneni Manoj, K. Sudhakar, and M. Samykano. 2019. “Performance comparison of BAPV and BIPV systems with c-Si, CIS and CdTe photovoltaic technologies under tropical weather conditions.” Case Studies in Thermal Engineering 13 (2019): 100374.
Land Transport Authority. 2023a. “Annual Vehicle Statistics 2023.” Available at: https://www.lta.gov.sg/content/dam/ltagov/who_we_are/statistics_and_publications/statistics/pdf/MVP01-4_MVP_by_fuel.pdf.
Land Transport Authority. 2023b. “Joint News Release by the Land Transport Authority (LTA) & NEA – Sustained Government Support to Encourage Vehicle Electrification.” News release. Available at: https://www.lta.gov.sg/content/ltagov/en/newsroom/2023/9/news-releases/sustained_govt_support_to_encourage_vehicle_electrification.html.
Land Transport Authority. 2024. “Factsheet: Expanding Singapore’s Electric Vehicle Charging Infrastructure.” News release. Available at: https://www.lta.gov.sg/content/ltagov/en/newsroom/2024/8/news-releases/expanding_Singapore_ev_charging_infra.html.
Land Transport Authority. n.d.-a. “Transitioning to EVs.” Available at: https://www.lta.gov.sg/content/ltagov/en/industry_innovations/technologies/electric_vehicles/transitioning_to_evs.html.
Land Transport Authority. n.d.-b. “Growing Singapore’s land transport network.” Available at: https://www.lta.gov.sg/content/ltagov/en/upcoming_projects.html.
Land Transport Guru. 2024. “Bus Interchanges and Terminals.” Available at: https://landtransportguru.net/bus-interchanges-and-terminals/.
Lau, Siu-Kit, Vesna Kosorić, Monika Bieri, and André.M. Nobre. 2021. “Identification of Factors Influencing Development of Photovoltaic (PV) Implementation in Singapore.” Sustainability 13(5): 2630.
Lee, Nian Tjoe. 2022. “S’pore’s largest train and bus depot to open in 2025, structural works 75% complete.“ Straits Times. Available at: https://www.straitstimes.com/singapore/transport/structural-works-for-east-coast-integrated-depot-75-complete-four-in-one-facility-to-open-in-2025.
Lee, Nian Tjoe. 2023. “Shell launches its fastest EV chargers powered by solar energy at 3 locations.” Straits Times. Available at: https://www.straitstimes.com/singapore/transport/shell-launches-its-fastest-ev-chargers-powered-by-renewable-energy-at-3-locations.
Li, Hong Xian, Yitao Zhang, David Edwards, and M. Reza Hosseini. 2020. “Improving the energy production of roof-top solar PV systems through roof design.” Architecture and Human Behavior 13: 475-487.
Loi, Esther. 2024. “Over 3,000 EV charging points now available at nearly half of all HDB carparks.” Straits Times. Available at: https://www.straitstimes.com/singapore/transport/ev-chargers-now-available-at-about-half-of-all-hdb-carparks.
Lu, Yujie, Ruidong Chang, Veronika Shabunko, and Amy Tan Lay Yee. 2019. “The implementation of building-integrated photovoltaics in Singapore: drivers versus barriers.” Energy 168: 400-408.
Nanyang Technological University. 2022. “S$5.7 million to ramp up campus solar energy production.” News release. Available at: https://www.ntu.edu.sg/news/detail/SGD5.7-million-to-ramp-up-campus-solar-energy-production.
Nishanthen, S. and Yeow Sze Hoe. 2019. “An exploratory study on electric vehicle adoption in Singapore.” Final Year Project. Nanyang Technological University.
Ong, Raymond. 2024. “What’s really driving COE premiums and the price of cars in Singapore.” Straits Times news clipping. Available at: https://cde.nus.edu.sg/cee/wp-content/uploads/sites/7/2024/08/raymondongnews20240816.pdf.
Ong, Ye Kung. 2021. “Speech by Minister for Transport, Mr Ong Ye Kung, at the Committee of Supply Debate 2021 on Singapore Green Plan 2030.” Speech. Available at: https://www.mot.gov.sg/news/Details/speech-by-minister-for-transport-mr-ong-ye-kung-at-the-committee-of-supply-debate-2021-on-singapore-green-plan-2030.
Reindl, Thomas. 2020. “Update of the Solar Photovoltaic (PV) Roadmap for Singapore.” https://www.seris.nus.edu.sg/wp-content/uploads/2023/07/Update-of-the-Solar-Roadmap-for-Singapore-March-2020.pdf.
Sembcorp. 2021. “Sembcorp Opens Singapore’s First Solar-powered EV Charging Hub.” News release. Available at: https://www.sembcorp.com/sg/news-and-insights/insights-and-stories/singapore/sembcorp-opens-singapore-s-first-solar-powered-ev-charging-hub/.
SG Green Plan 2030. n.d. “Our Key Targets for the Green Plan.” https://www.greenplan.gov.sg/targets/.
Shell. n.d. “Shell recharge for EVs.” Available at: https://www.shell.com.sg/motorists/shell-recharge-for-ev.html.
Singapore Computer Society 2023. “Expert Guide to EV and EV Charging Stations in Singapore.” Available at: https://www.scs.org.sg/articles/ev-charging-stations-singapore
Staffell, Iain, Stefan Pfenninger, and Nathan Johnson. 2023. “A global model of hourly space heating and cooling demand at multiple spatial scales.” Nature Energy 8: 1328–1344.
Tan. 2023. “NUHS public hospitals roll out EV charging; electric ambulances, solar roof panels in the pipeline“. Straits Times. Available at: https://www.straitstimes.com/singapore/transport/nuhs-public-hospitals-roll-out-ev-charging-electric-ambulances-solar-roof-panels-in-the-pipeline.
Wang, Dawei, Nada Zamel, Kui Jiao, Yibo Zhou, Shuhai Yu, Qing Du, and Yan Yin. 2013. “Life cycle analysis of internal combustion engine, electric and fuel cell vehicles for China.” Energy 59: 402-412.
Xu, Min, Qiang Meng, and Yisi Liu. 2018. “Public’s Perception of Adopting Electric Vehicles: A Case Study of Singapore.” Journal of the Eastern Asia Society for Transportation Studies 12: 285-298.